
Purpose: This article will provide a clear and actionable overview of your shipping activities, enabling effective management and optimization of your logistics processes.
The Shipping Overview Dashboard allows you to analyse data starting from January 1st, 2024. Any comparisons or trend analyses will use this date as the earliest available reference point. Data from before this date is not accessible through the dashboard.
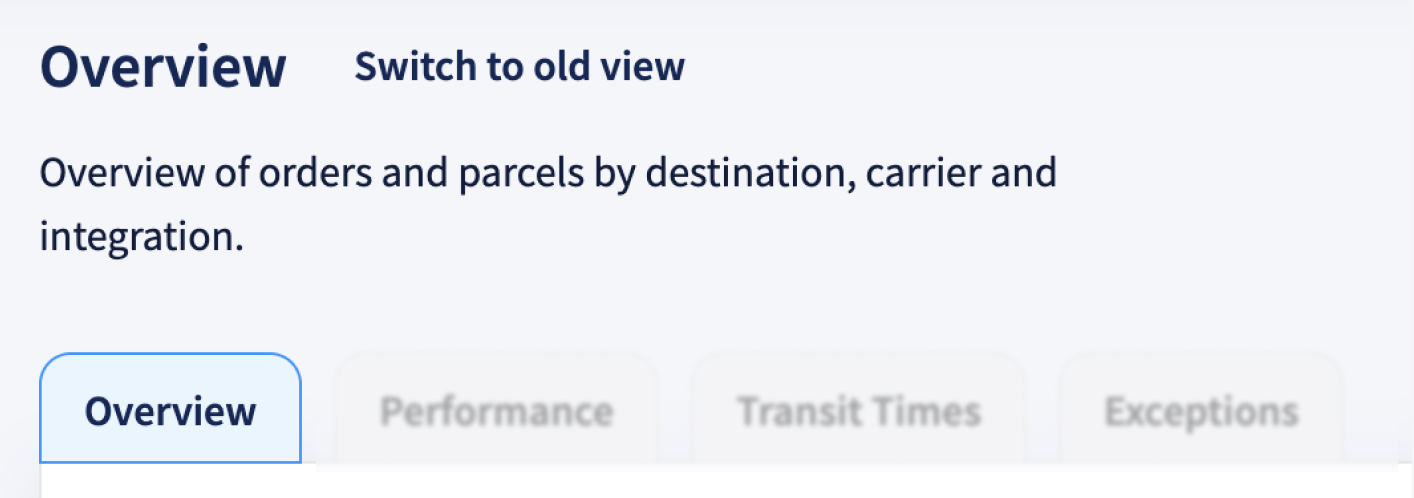
Shipping Overview Explained
The Shipping Overview dashboard gives you a high-level view of your outbound shipping activity. It helps you track key metrics like incoming orders, created labels, shipped parcels, return rates, and parcel distribution across countries, carriers, and sales channels.
You can use filters to explore trends over time and across specific segments like carrier, destination, brand, or integration. This dashboard is ideal for identifying patterns, spotting irregularities, and gaining quick insights into your overall shipping volume and flow.
Trends
| Arrows | ↗ Indicates an increasing trend compared to the previous period*. This may represent a positive or negative change depending on the KPI. | ↙ Indicates a decreasing trend compared to the previous period*. Like the upward arrow, whether this is positive or negative depends on the specific KPI. |
| Colors |
● Represents an improvement in the metric. This does not necessarily mean an increase; in some cases, a decrease is desirable. For example, a lower return rate indicates fewer shipping issues and improved customer satisfaction. |
● Represents a decline in performance. However, an increase may also be negative, such as a rise in returns or parcels delays, which could signal operational inefficiencies. |
*What does "previous period" mean?
By default, the previous period refers to the timeframe immediately before the currently selected date range. It follows the same length as the selected period.
- If you choose a single month, the previous period is the month before (e.g., February 2025 → January 2025).
- If you select a range of months, the previous period will be the same length of time directly before that range (e.g., October–December, → July–September).
If you use the comparison filter, the trend metrics will be based on the custom timeframe you select, not the default "previous period." This means trends will reflect your chosen comparison range, rather than the automatically calculated period before your selected date range.
Filters
The analytics feature includes multiple filter options, allowing you to refine data and analyze specific aspects of your shipping activities. Using filters effectively helps in identifying trends, assessing performance, and making data-driven decisions.
Check here the available filters and their applications
You can customize the dashboard view using the following filters:
- Add Date Range (Shipping Overview only) – Use this filter to compare your selected timeframe against a second, custom date range. Applying this filter updates all graphs and trend metrics to reflect the comparison, enabling deeper analysis between two distinct periods.
- Brand – Filter parcels by a specific brand if multiple brands are managed under one account.
- Carrier – View parcels handled by a particular carrier to assess performance and reliability.
- Destination Country – Focus on parcels delivered to a specific country to evaluate regional shipping efficiency.
- Integration – Narrow down parcels by sales channels, such as specific e-commerce platforms or order management systems.
- Origin Country – Analyze parcels based on their country of origin to assess outbound shipping trends.
- Product Name – Filter data based on specific products to track their shipping performance and return rates.
- Product SKU – Use SKU-based filtering to monitor the parcels trends of individual product variants.
KPIs and their description
Incoming Order Count
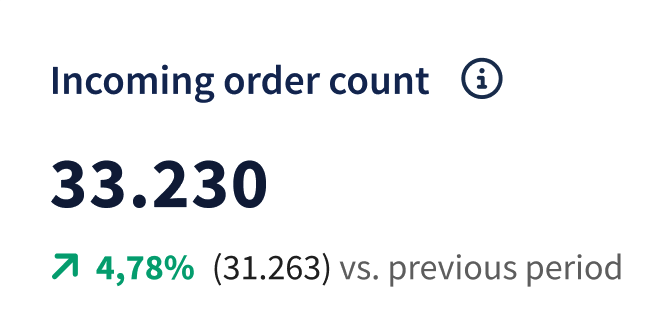 What it shows: This key performance indicator (KPI) tracks the number of unique incoming orders by counting distinct order IDs within the selected timeframe, based on the filters applied.
Trend analysis: By default, the dashboard compares the selected period to the previous period of the same length (e.g., last 30 days vs. the 30 days before that).
However, if you apply the comparison date filter, the trend will update to reflect your custom comparison range instead of using the default previous period.
An increase in orders indicates higher business activity, while a decrease suggests reduced demand.
Note: This metric is essential for understanding customer demand and making informed decisions about inventory and fulfillment.
Labels Created
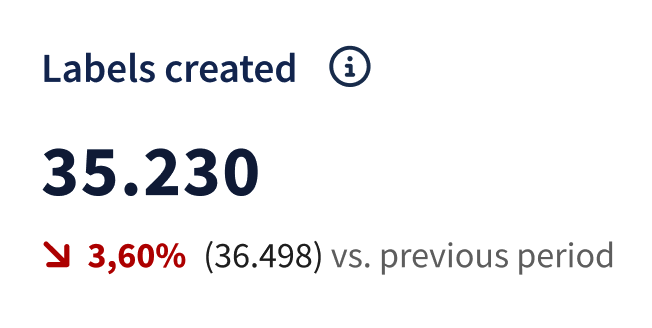 What it shows: This KPI counts the total number of shipping labels created, including those that were unused or canceled. An increase in label creation typically indicates heightened shipping activity, while a decrease may point to inefficiencies or reduced demand.
Note: Comparing this with the actual number of shipped parcels can highlight discrepancies, such as unused or canceled labels, helping to identify potential operational gaps.
Trend behavior: By default, the trend compares the current period to the previous period. However, if you apply a custom comparison filter (e.g., “Last 30 days” vs. “Last calendar month”), the trend will update accordingly, reflecting the custom timeframes instead of the standard previous period logic.
Total Parcels Shipped
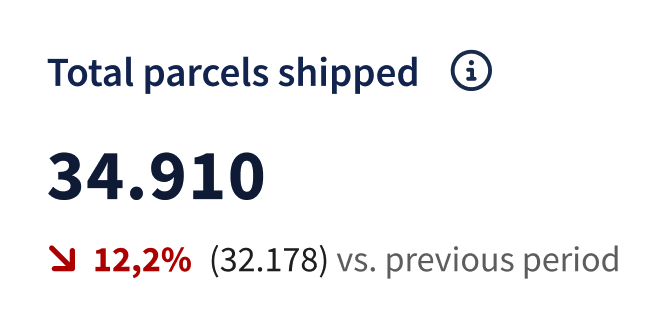 What it shows: This KPI tracks the number of parcels processed and shipped within the selected timeframe, providing a snapshot of shipping activity and operational efficiency.
An increase in parcels shipped reflects growth or higher operational success, while a decrease may indicate potential issues that require attention.
Note: This KPI is crucial for tracking the efficiency of your shipping operations.
Returns
 What it shows: This KPI tracks all inbound parcels initiated by the customer.
A red upward arrow indicates an increase in returns, signaling potential issues with product quality or shipping accuracy. Conversely, a green downward arrow means fewer returns, suggesting improved customer satisfaction or delivery accuracy.
Total parcels Per Destination (Geo-Map)
What it shows: This interactive geo-map displays the number of created shipping labels, including unused or canceled labels, grouped by destination within the selected timeframe. The color intensity, darker shades of blue, indicates higher volumes of labels created.
Interactive Features:
- Hover to explore: Move your cursor over countries to view label volume data.
- Click to filter: Clicking a country or region zooms in and applies it as a filter, automatically updating the report to show focused destination data.
- Navigation tools: Use the dropdown menu at the bottom right to switch views between continents, with Europe set as the default.

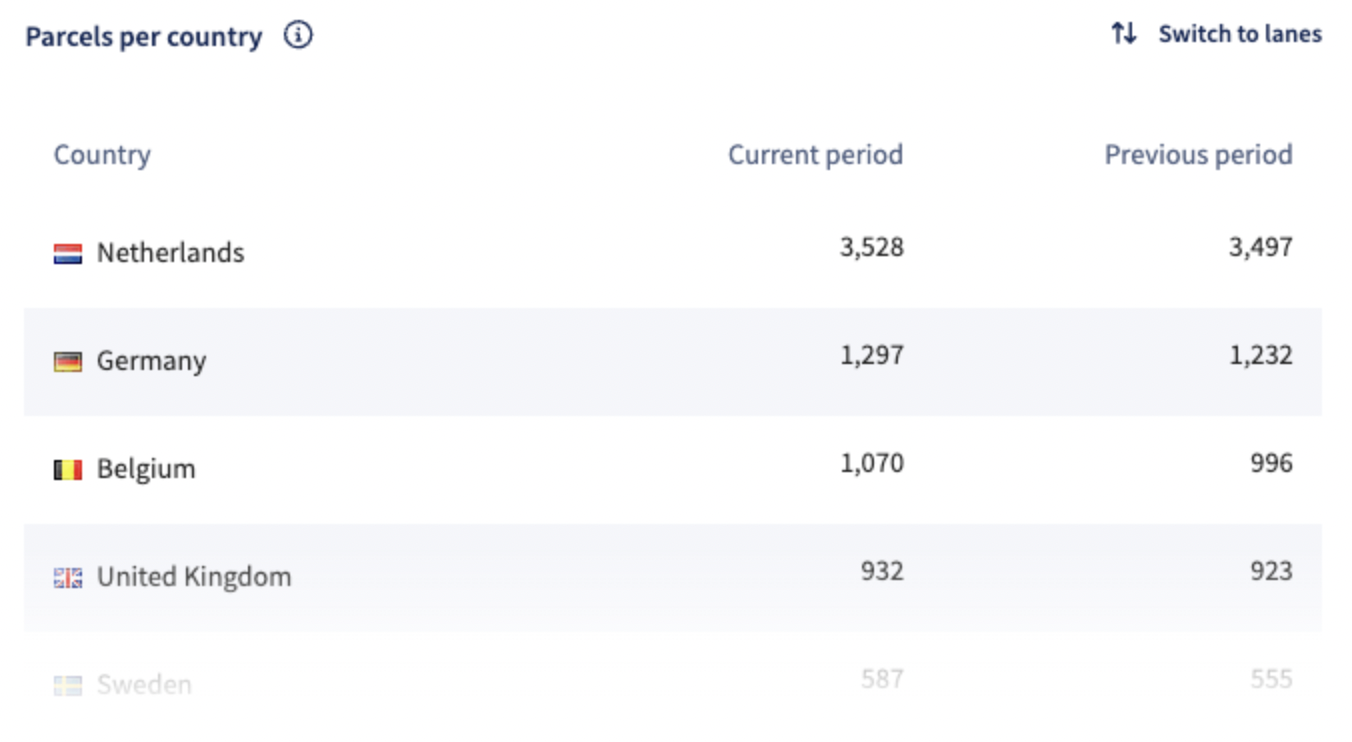
Parcels Per Country
What it shows: This detailed table tracks the number of created shipping labels, including unused or canceled labels, within the selected timeframe, broken down by destination country.
You can view data for both the current and previous periods to compare trends over time.
The data includes:
- Parcels column: Displays the number of created shipping labels for each destination.
- Previous period column: Shows the number of labels created in the previous timeframe.
- Percentage column: Indicates each country’s share of the total volume.
Interaction and Navigation:
- Scroll functionality: Use the vertical scroll to view more countries.
- Switch to lanes: Toggle to view data by shipping lanes for a detailed look at country-to-country parcel flows.
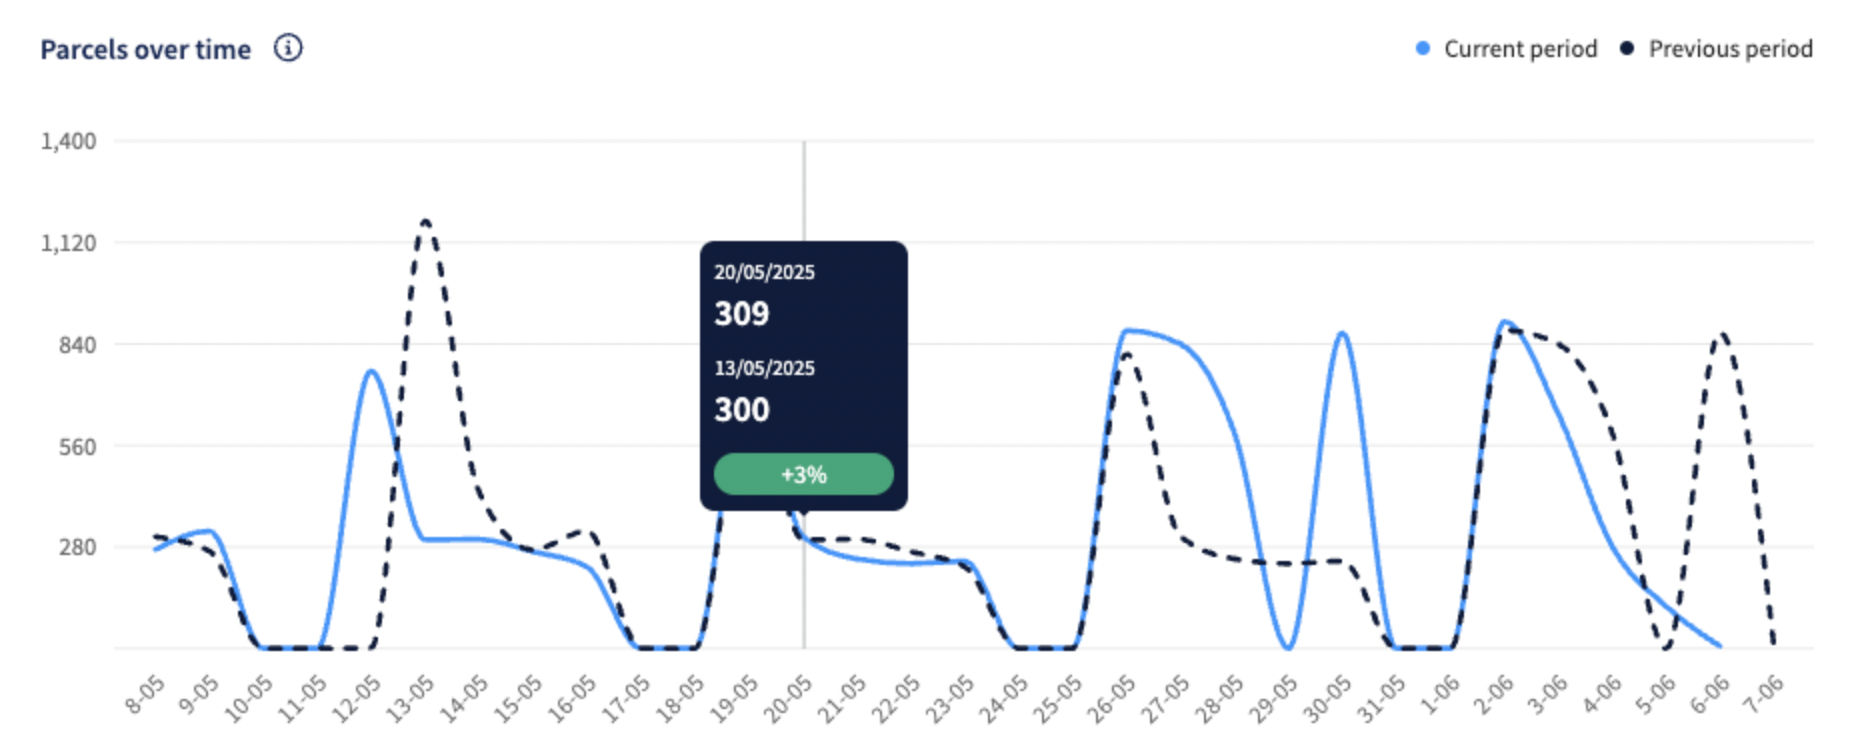
Parcels Over Time
What it shows:
This chart provides a visualization of the number of created shipping labels, including unused or canceled labels, grouped by time interval (e.g., days, weeks, or months). It illustrates volume changes and trends in your shipping activity within the selected timeframe.
-
Trend line:
The trend line displays changes in label volume over time, helping you identify patterns, peak periods, and fluctuations in overall logistics activity. -
Hover tooltip:
When you hover over the chart, a tooltip shows the current period vs. previous period values, along with the percentage change, giving you a clear view of the trend direction and magnitude.
Return Rate
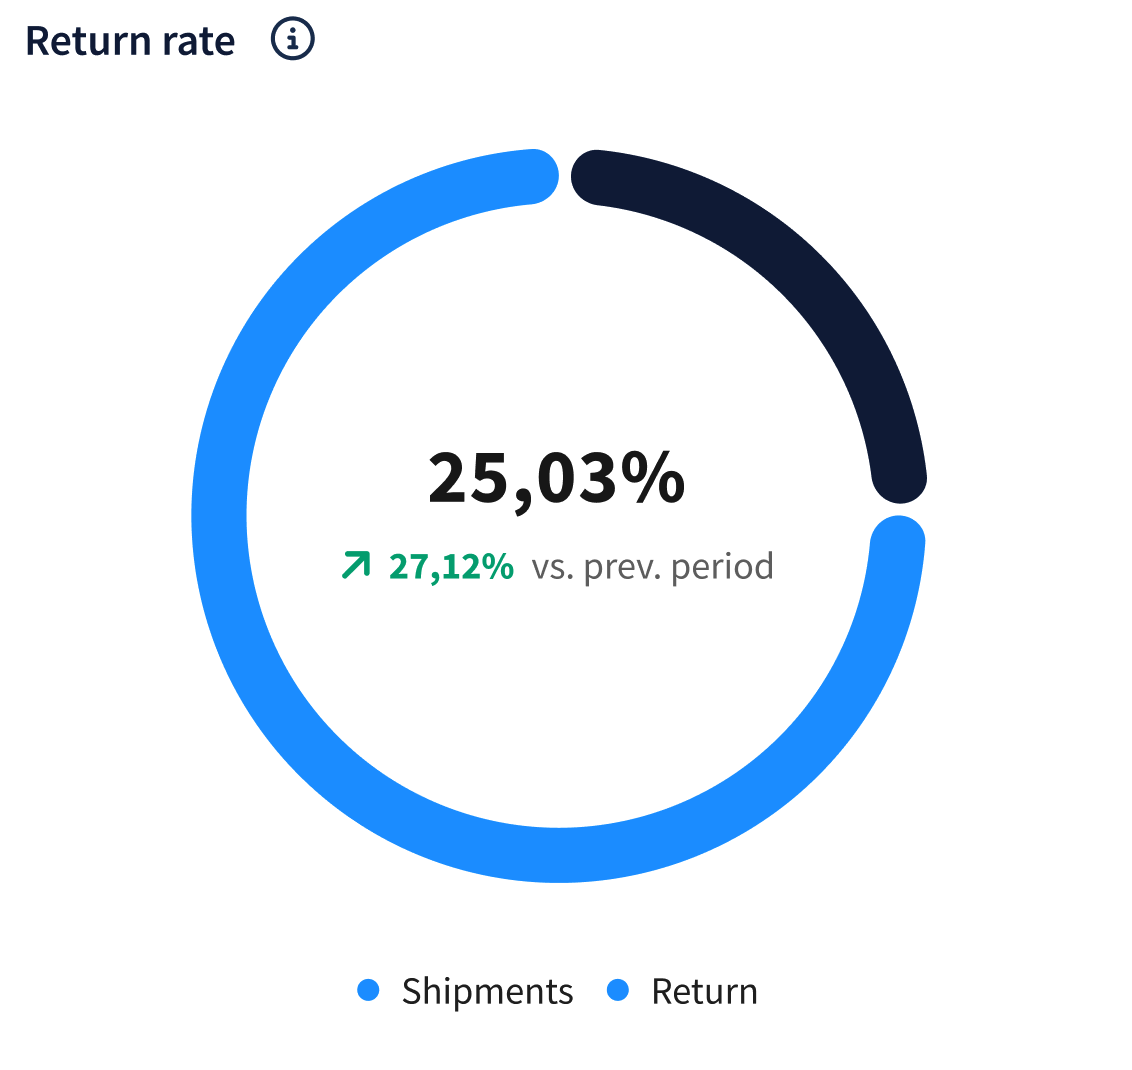 What it shows: This pie chart shows the ratio of parcels returned by the customer vs. parcels shipped.
- The return rate is calculated as:
(Total number of inbound parcels ÷ Total number of parcels) × 100%
A decrease in the return rate indicates improved customer satisfaction or better delivery success, while an increase may highlight issues needing attention, such as product quality or shipping accuracy.
Parcels per Integration
What it shows:
This table displays the number of created shipping labels, including unused or canceled labels, grouped by each connected integration or online store. It provides insights into the shipping activity and relative share of each sales channel connected to Sendcloud.
- Data display: Shows both the absolute number of created labels and the percentage contribution of each integration to the overall label volume.

Parcels Per Carrier
What it shows: This chart displays the number of created shipping labels, including unused or canceled labels, grouped by carrier. It provides a detailed view of how your shipments are distributed across different logistics providers.
- Key insight: By visualizing label volume per carrier, you can assess carrier usage patterns and make informed decisions about performance, logistics planning, and potential carrier negotiations — even before actual shipments take place.
