
Purpose: This article helps you understand the Analytics for Tracking dashboard and its KPIs, giving you insight into your total email, SMS, and WhatsApp tracking notifications sent on your behalf.
Before you start
Analytics for Tracking is in beta and available for all subscriptions. As we continue refining it, you may notice small changes to the dashboard over time.
This dashboard shows your total notification volume across your account, rather than a breakdown for a single parcel. To see the individual email notifications sent for one specific parcel, go to the Shipped labels tab, click the eye icon, and check the Notification History section, as explained in Shipment status and parcel detail view.
Tracking notification data is available from July 10, 2026 onwards. Data sent before this date can't be shown or backdated.
Analytics for Tracking explained
The Analytics for Tracking dashboard gives you insight into the tracking notifications sent to your customers across email, SMS, and WhatsApp. Use it to see your notification volumes by country, carrier, integration, and message type, and to spot channels you haven't set up yet.

The dashboard is split into four tabs:
- Overview – combined totals across email, SMS, and WhatsApp.
- Email – details for email notifications only.
- SMS – details for SMS notifications only.
- WhatsApp – details for WhatsApp notifications only.
Filters
The analytics feature includes filter options that let you refine the data and analyze specific aspects of your tracking notifications.
Check here the available filters
- Date range – select a specific time period. Defaults to the last 30 days.
- Brand - filter by a specific brand if multiple brands are managed under one account.
- Channel – filter by email, SMS, or WhatsApp.
- Message type – filter by a specific notification (for example, "Shipment created" or "Out for delivery").
- Recipient country – filter by the country the notification was sent to.
KPIs and their description
Overview tab
The Overview tab shows your combined notification activity across all three channels.
Emails sent, SMS messages sent, WhatsApp messages sent
What it shows: Three KPI cards showing the total number of notifications sent through each channel within the selected date range, with the percentage change compared to the previous period.
Utility: Use these cards to see at a glance whether you're sending tracking notifications through all three channels, and how your volumes are trending. If a card stays at 0, that channel likely isn't active on your account yet.

Notifications sent per country
What it shows: A map and a table showing how your combined notifications (email, SMS, and WhatsApp) are distributed across recipient countries within the selected date range.
Utility: This helps you understand where your customers are, and whether your notification volumes match your shipping destinations.

Notifications sent over time
What it shows: A line chart with one line per channel, showing the combined volume of notifications sent per day, week, or month within the selected date range.
Utility: Use this chart to spot trends, peaks, and dips in your overall notification volume, and to compare channels against each other over time.

Notifications sent per integration
 What it shows: A table showing the number of notifications sent, grouped by the connected integration or sales channel that triggered them.
Utility: This helps you see which of your sales channels generate the most tracking notification volume.
Notifications sent per carrier
What it shows: A bar chart showing the number of notifications sent, grouped by carrier.
Utility: This helps you understand how notification volume is distributed across the carriers you use.
Email, SMS, and WhatsApp tabs
The Email, SMS, and WhatsApp tabs each show the same layout, filtered to that one channel. Card titles follow the channel name: on the Email tab they read "Email notifications sent," on the SMS tab "SMS notifications sent," and on the WhatsApp tab "WhatsApp notifications sent." The descriptions below use "notifications" generically — read it as whichever channel's tab you're on.

Notifications sent
 What it shows: The total number of notifications sent through this channel within the selected date range, with the percentage change compared to the previous period.
Total notifications sent by country / Notifications sent per country
What it shows: An interactive map, with a continent selector, showing where your notifications for this channel were sent. Next to it, a table breaks the same data down by country, with the number of messages and their percentage of the total.
Utility: This helps you understand where your customers are, and whether your notification volumes match your shipping destinations.


Total notifications sent over time
What it shows: A line chart showing the volume of notifications for this channel per day, over the selected date range.
 Total notifications sent per message type
What it shows: A donut chart showing the share of notifications sent per message type, with the total count for this channel shown in the center.
Notifications sent per message type
What it shows: A bar chart listing each message type with its count and percentage of the total, sorted from highest to lowest volume.
Utility: Use this to see which of your tracking notifications are actively firing and which available message types you haven't enabled yet.


Notifications sent per integration
What it shows: A table showing the number of notifications for this channel, grouped by connected integration, with each integration's share of the total.
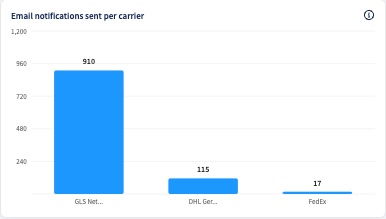 Notifications sent per carrier
What it shows: A bar chart showing the number of notifications for this channel, grouped by carrier.